When watching an AFL game its easy to get swept up in the talk of team x is dominating the clearances and this is explains why they are up in the game or have won the game. But does it really and can we assess this?
Lets start with a simple premise, if we covered up the final score and just based on game statistics can we make inference about who won the game?
Clearly in doing this we have to strip out the obvious i.e. goals, scoring shots. The reasoning behind this is we don’t want to state the obvious i.e. teams that score more goals win more. If we keep variables that make up the score we can quite confidently say that they are going to win which isn’t that fun……
What about the less obvious, do teams that win contested possessions win more than teams that lose the contested possession count? Do teams that win the clearances win more than others. What about the tackle count, or teams that make less mistakes (clangers) or the uncontested possession count.
Let’s look at some of the commentator favorites like clearances and contested possessions it be great to look at meters gained but you know Champion isn’t into releasing that kind of thing…..
The purpose of model selection is to choose a model from all possible models with desirable properties. Usually this would involve minimising the $description loss + \lambda \cdot Model complexity$
We want to have a trade off between descriptive power and complexity. We don’t want our model to overfit (useless) or have so many variables that while accuracy is good, usability is poor.
Description loss is usually measured by -2log liklihood and model complexity is the number of parameters in the model.
Visually what we would like to see, is if a variable is important when modelling. Take for example clearances. How often do you hear when watching the footy that the team is up in clearances and this explains why they are winning.
Let’s model this…..
The variables I have chosen to model are the “commentator favorites”
- Clearances
- Uncontested Possessions
- Contested possessions
- Tackles
- Clangers
- Inside 50s/Rebound 50s (How often the ball comes in vs comes out of its attacking 50m)
- Rebound 50s/Inside 50s (How often the team gets the ball out inside its defensive 50m)
The “input variables” are the differences i.e. if team a gets 40 clearances and team b gets 20, team a’s input value for clearances is 20 and team b is -20 etc
The outcome variable in this case is 1 if team wins, 0 if team loses.
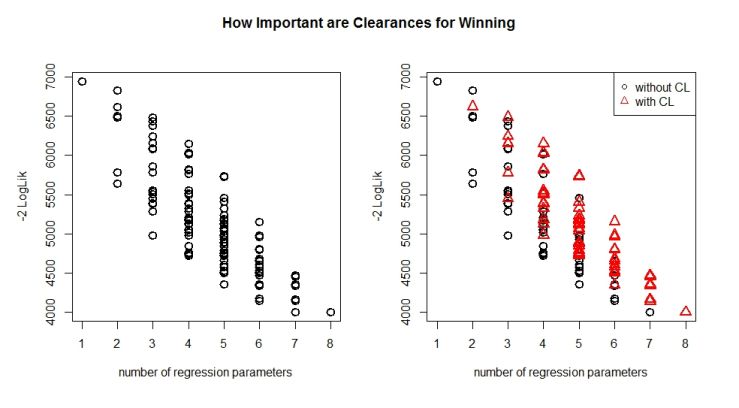
Caption for the picture.
Looking at the plot about, we can see that for all the unique combination of 2,3,4,5,6 and 7 parameters models there exists a model where you will get LESS descriptive loss when you EXCLUDE clearances in the model building process.
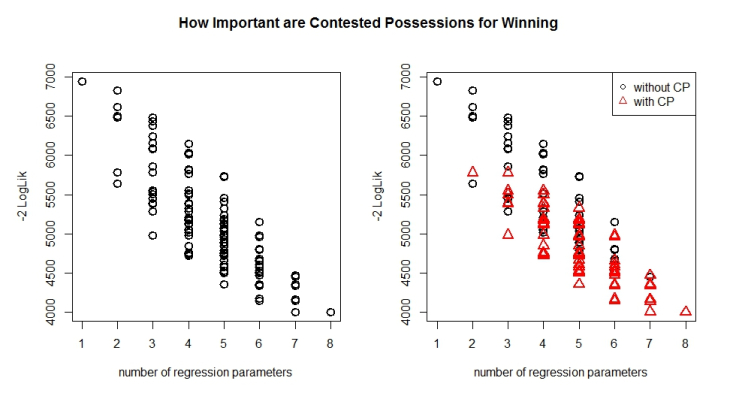
How do contested vs uncontested possessions fare in this descriptive loss vs number of parameter battle?
From these graphs it would seem as though for unique combinations of regression parameters you are better off without contested possessions when faced with a choice between contested and uncontested possessions!
However the very best model i.e. the lowest is the one that contains contested possessions. Which just shows how interesting interaction effects can be!
We can see this a bit closer below.

These graphs have some nice implications going forward
- These graphs are based off all games from 2003-2015 including finals. It would be interesting to see if the characteristics of finals wins are different from home and away wins by sub-setting the data
- Nice visual representation of if a variable should be including/excluded
- Good way to see the trade between complexity and description loss, as a personal aside I prefer less to more.
The R used for these plots was edited from the code provided by this paper which like all good scripts is reducible and links are provided in the paper